Playing the lotto is a gamble.
But despite their seemingly random results, you might wonder if there are any lucky numbers that win more often than others.
With this in mind, we went off and scraped 10 years worth of Powerball lottery results (US) and Lotto Max results (Canada) to see how these two lotto giants compare to each other.
How we found the luckiest lotto numbers to play
For this project, we used ParseHub, a free and powerful web scraper that can extract data from any website. We used it to pull the winning numbers from 2011 to 2020 from both the Powerball and Lotto Max.
We then analyzed the data we scraped to come up with the luckiest numbers for each lotto / country.
What are the luckiest Lotto numbers? 💸💸💸
— ParseHub (@parsehub) February 18, 2021
We scraped 10 years of lottery results to find out.
39 might become our new favorite number 🤔https://t.co/PZHYsvyzXp pic.twitter.com/IUc3dFm3EE
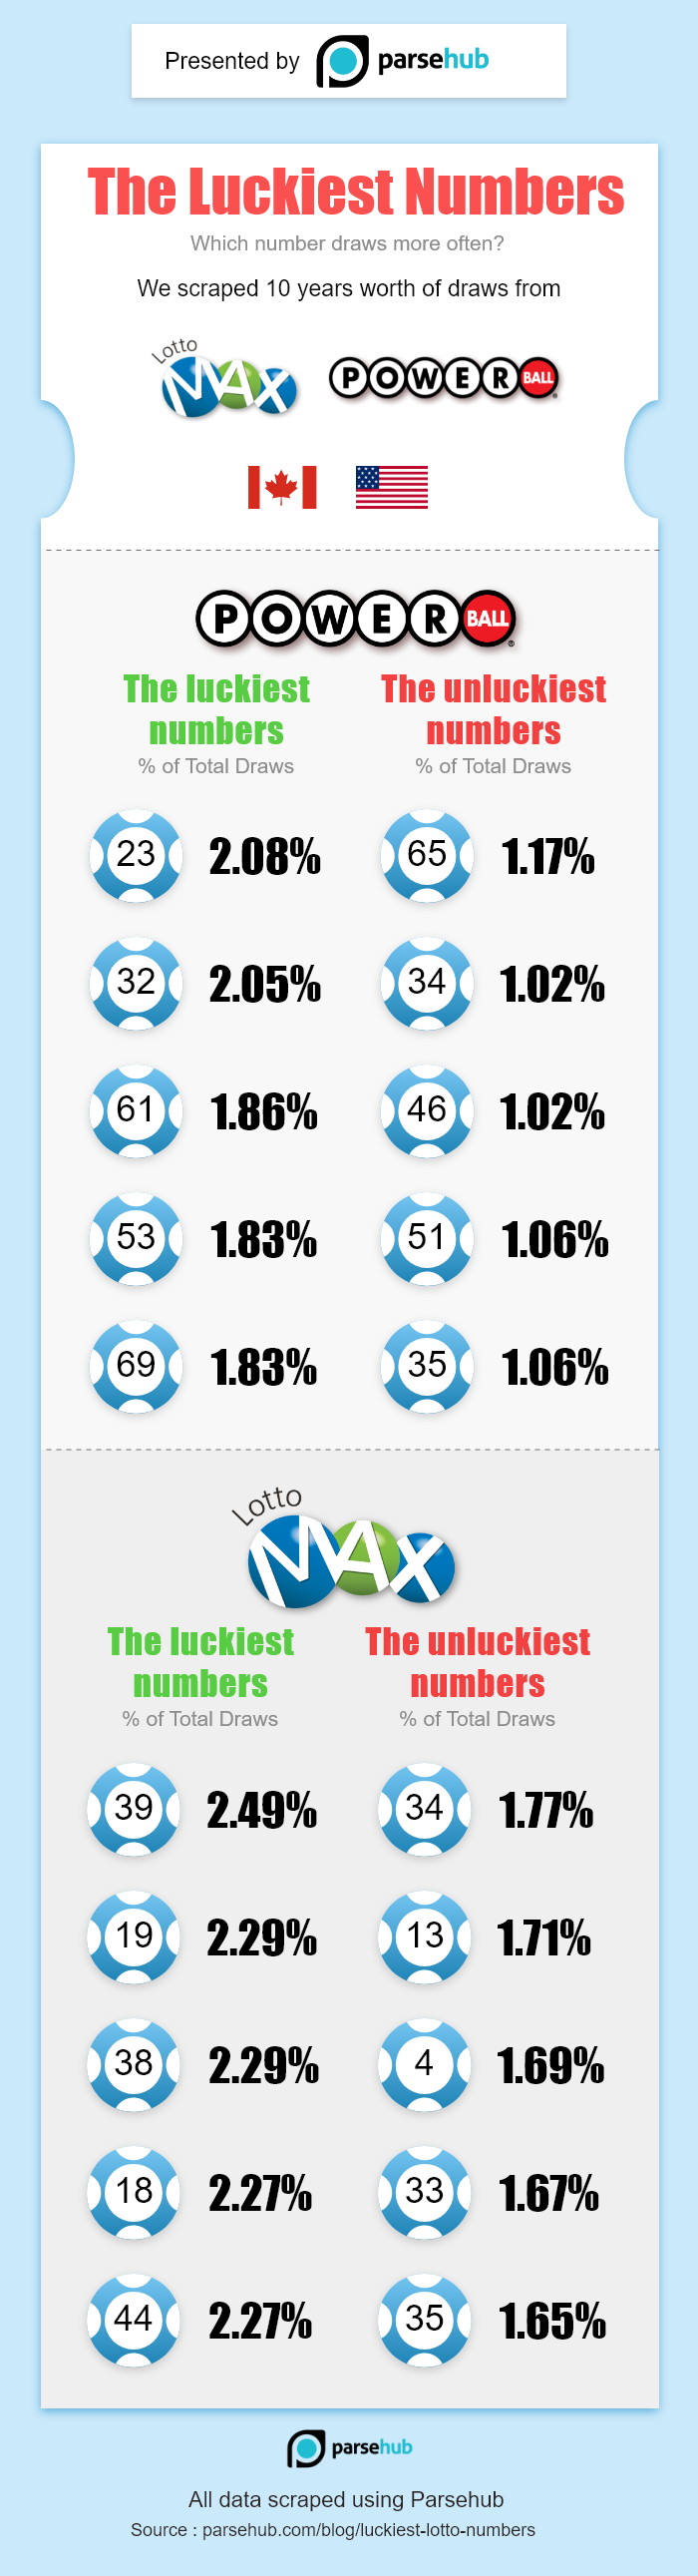
Luckiest Powerball Lotto Numbers (USA)
When playing Powerball, any number from 1 to 69 can come up as one of the winning 5 numbers for each draw (white balls). While a 6th number is pulled from a pool of red balls from 1 to 26.
While we scraped 10 years of Powerball results, the Powerball actually changed the format of their game in October of 2015, with more numbers being added to the pool. As a result, we based our analysis on the past 5 years of results.
After scraping Powerball results for the last 5 years, the luckiest white ball Powerball numbers were:
- 23 being drawn on 2.08% of all draws.
- 32 on 2.05% of all draws
- 61 on 1.86% of all draws
- 53 and 69 on 1.83% of all draws
- 64 on 1.79% of all draws
- 3 on 1.72% of all draws
- 21, 27 and 62 on 1.68% of all draws
But how lucky are really these numbers? On average, these 10 numbers were drawn an average of 50 times.
In comparison, the 10 least common (or unluckiest) numbers were drawn an average of 30 times. That means these numbers are almost twice as likely to be drawn as their unlucky counterparts (1.66 times as likely to be more precise).
Unluckiest Powerball Numbers
So, which are the unluckiest Powerball white ball numbers that get drawn less frequently?
Let’s breakdown the unluckiest numbers:
- 24 and 58 drawn on 1.21% of all draws
- 4, 26, 38 and 65 on 1.17% of all draws
- 51 and 35 on 1.06% of all draws
- And lastly, the unluckiest numbers are 46 and 34 on 1.02% of all draws.
You can now see that the difference in draws between the luckiest and the unluckiest numbers.
Luckiest Lotto Max Numbers
Now we turn our attention to the Lotto Max from Canada.
For this draw, 8 numbers from 1 to 49 are drawn (up to 50 since 2019, we will only look at 1-49 for this analysis).
We analyzed 10 years worth of Lotto Max draws and the luckiest numbers were:
- 39 being drawn on 2.49% of all draws
- 19 and 38 on 2.29% of all draws
- 18 and 44 on 2.27% of all draws
- 28, 1, 15, 22 and 24 on 2.24% of all draws
On average, these numbers have been drawn 110.9 times. In contrast, the bottom 10 unluckiest numbers average 85.1 draws.
Unluckiest Lotto Max Numbers
So, which are the unluckiest numbers for Lotto Max draws?
Let’s break them down:
- 43 being drawn on 1.85% of all draws
- 32 on 1.83% of all draws
- 21, 49 on 1.79% of all draws
- 29 and 34 on 1.77% of all draws
- 13 on 1.71% of all draws
- 4 on 1.69% of all draws
- 33 on 1.67% of all draws
- And the unluckiest number is 35 only being drawn on 1.65% of all draws in the last 10 years
So, What are the Luckiest Lottery Numbers?
Well, as anyone with statistical knowledge will tell you, this historical data of numbers drawn has zero impact on future drawings.
Meaning that using this historical data to pick your next series of numbers is as effective as just choosing them at random.
However, it is fun and interesting to look at all the numbers in hindsight and see what the “luckiest” numbers have been over the years.
In this case, that’s 23 in the US and 39 in Canada.
Want to start your own web scraping project? Check our beginner guide on web scraping.
View the other research pieces we have done: