
Update: The Tableau + ParseHub Web Data Connector will soon be depreciated in an upcoming version of Tableau. We have updated this guide with 2 alternative methods.
Web scrapers are great at extracting and organizing all the data you might need from a website.
However, web scrapers are not the best option when it comes to visualizing the data you’ve extracted.
Here’s where a data visualization tool like Tableau can be quite useful.
Tableau
Tableau is an extremely advanced data visualization tool. With its several integrations, Tableau lets you create visual dashboards for almost any dataset.
You can get started on Tableau with a 14-day trial.
ParseHub
ParseHub is an incredibly powerful web scraper able to scrape dynamic websites that most web scrapers cannot render. Additionally, ParseHub is also free to download and use.
Want to learn more about ParseHub and web scraping? Read our definite guide on web scraping.
Tableau + ParseHub integration
Integrating data scraped by ParseHub into Tableau is actually quite easy.
First, we’ll select the data set we want to import from ParseHub. In this case, we’ve chosen a project where we scraped the first 80 product listings for “tablets” on Amazon.com.
Method 1 - CSV Import
With the project CSV downloaded from ParseHub, we start our project by launching Tableau.
- In Tableau, on the left sidebar, click on “More…” under the “To A File Menu”
- Navigate to the CSV file you’ve downloaded from ParseHub.
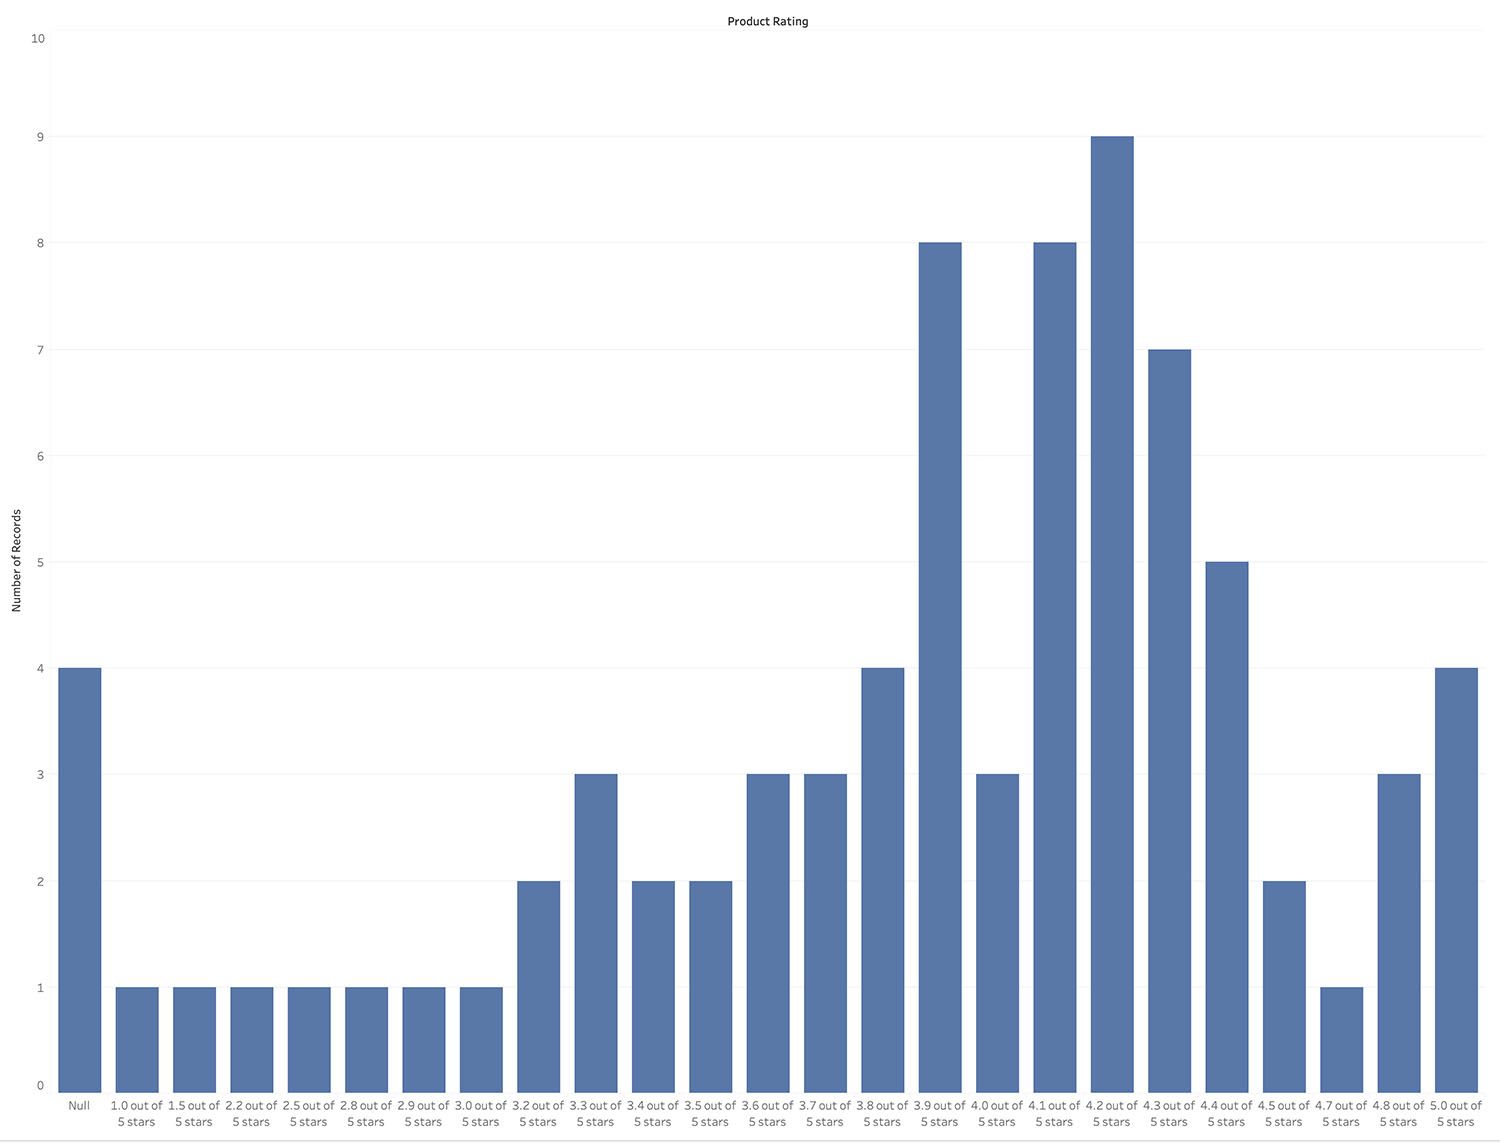
- You will now be able to use the data from the CSV to create visualizations. Below we’ve created a simple graph showing the average rating score for tablets on Amazon.
Method 2 - Google Sheets Implementation
In some cases, you might have a project that runs on a daily schedule to get the most recent data. A Google Sheets implementation will be more useful in such cases.
- In ParseHub, open up your scheduled project and go to its settings by clicking on the cogwheel on the top left of the screen.
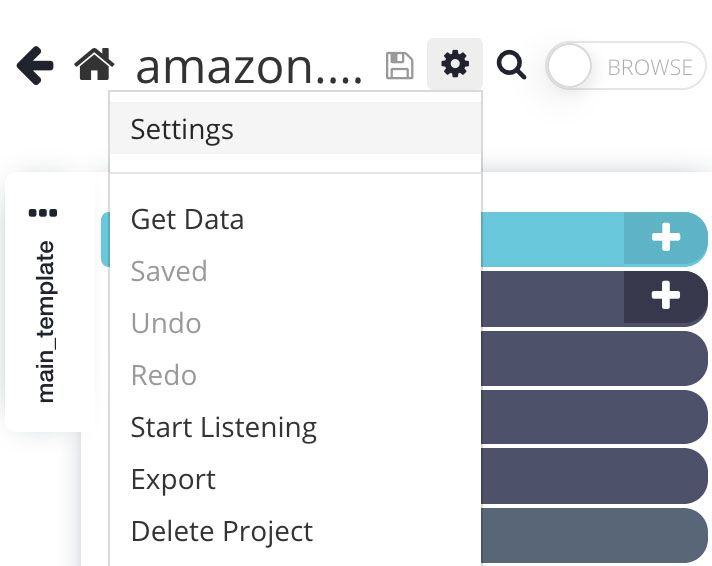
- Here, you will find your Project Token and your API Key.
- Create a new Google Sheets document and give it a recognizable name.
- Click on the A1 cell and enter the following function:
=IMPORTDATA("https://www.parsehub.com/api/v2/projects/PROJECT_TOKEN/last_ready_run/data?api_key=API_KEY&format=csv")
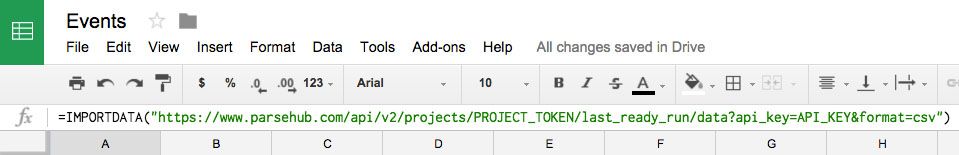
- Now, in the function above, replace PROJECT_TOKEN and API_KEY with the values you found in step 2.
- Google Sheets now should automatically update with the latest scrape results from ParseHub.
- In Tableau, on the left sidebar, click on “More…” under the “To a Server” and select Google Sheets
- Go through Tableau’s authentication process with Google and select the Google Sheets document you have just created.
- Tableau will now use this Google Sheet as a data source which will be updated every time ParseHub runs a scrape as per the schedule you’ve set up.
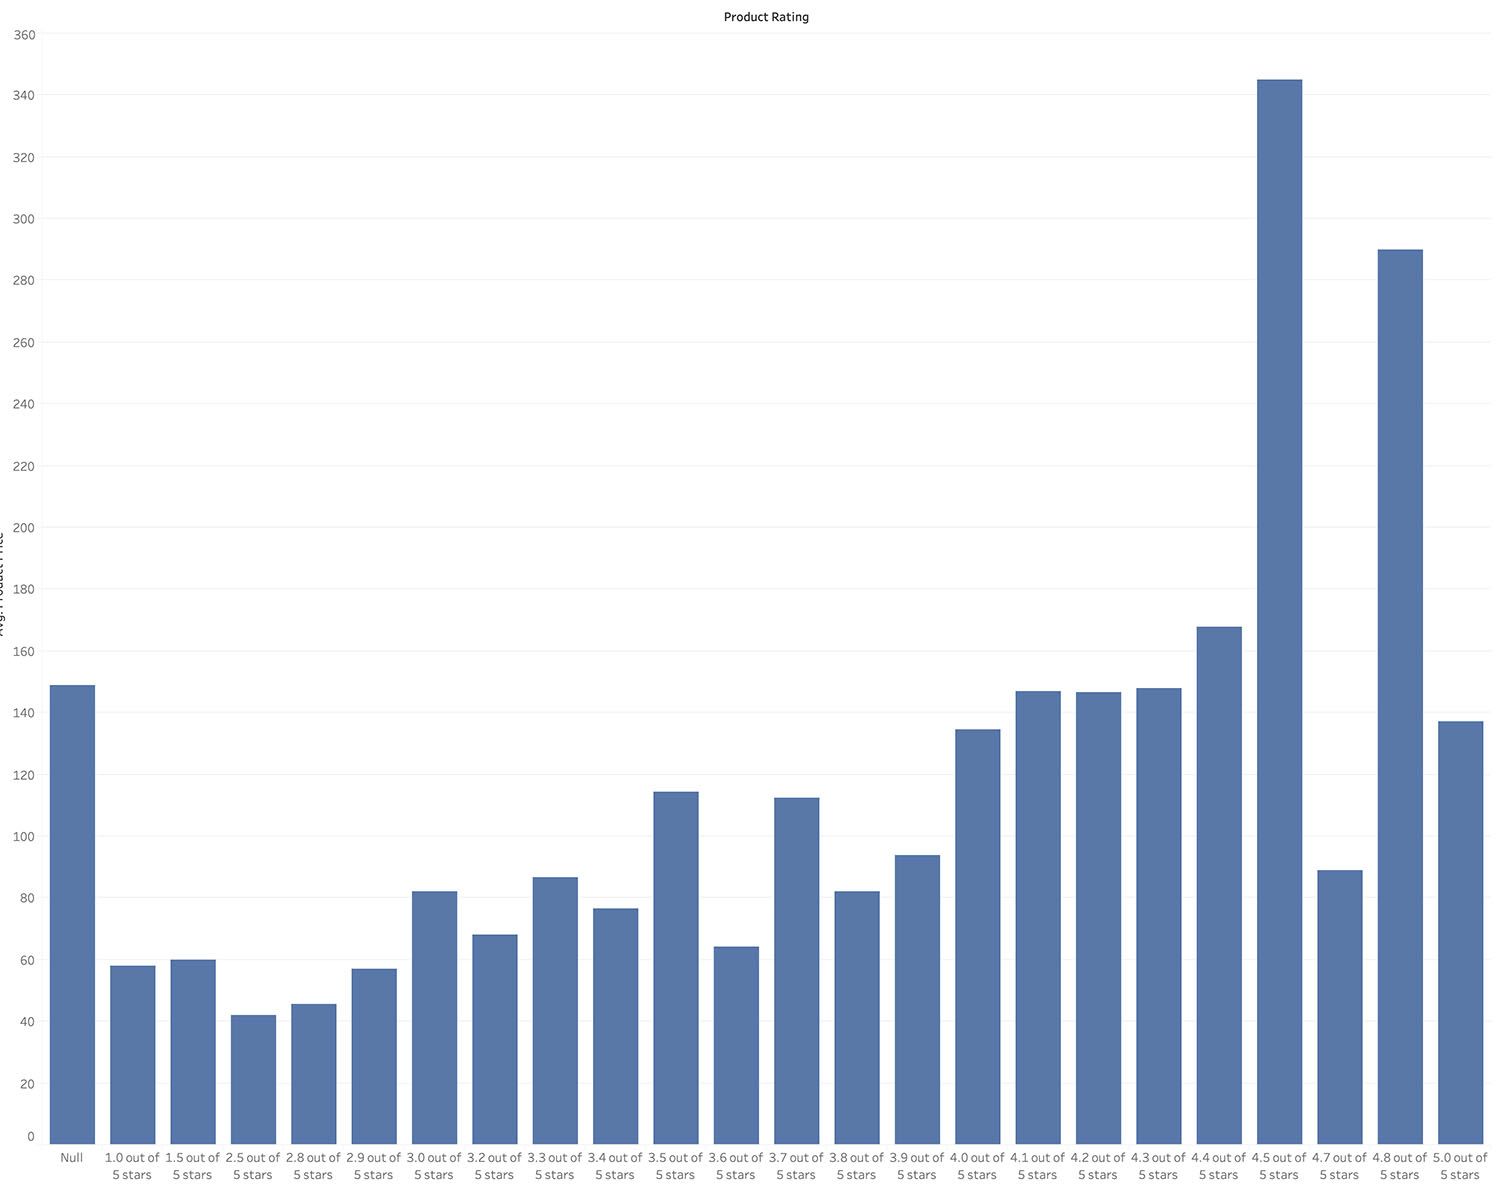
- Below we’ve created a simple graph showing the average tablet price per rating score.
If you run into issues with this method, make sure to read our guide on how to scrape websites into Google Sheets.
[This post was originally written on March 05, 2016 and updated on August 22, 2019]