The team behind ParseHub – a web scraping tool – just finished researching the cost of public and private University tuition in 40 countries. We used web scraping to collect statistics from three different tables that had economic data – the monthly living wage, the monthly low skilled worker wage and minimum hourly wage. Automating the process of data extraction saved us hours that we would have spent coping and pasting if we did not have a quick data collection tool available.
After setting up a web scraping desktop app to collect all of the data, we downloaded the web data in Excel and cleaned it up. During the process, we used regular expressions within the scraping app to clean up how the text would appear in our Excel file.
Lastly, we imported the scraped data into Tableau and visualized several bar graphs and world maps (like the one you see below).
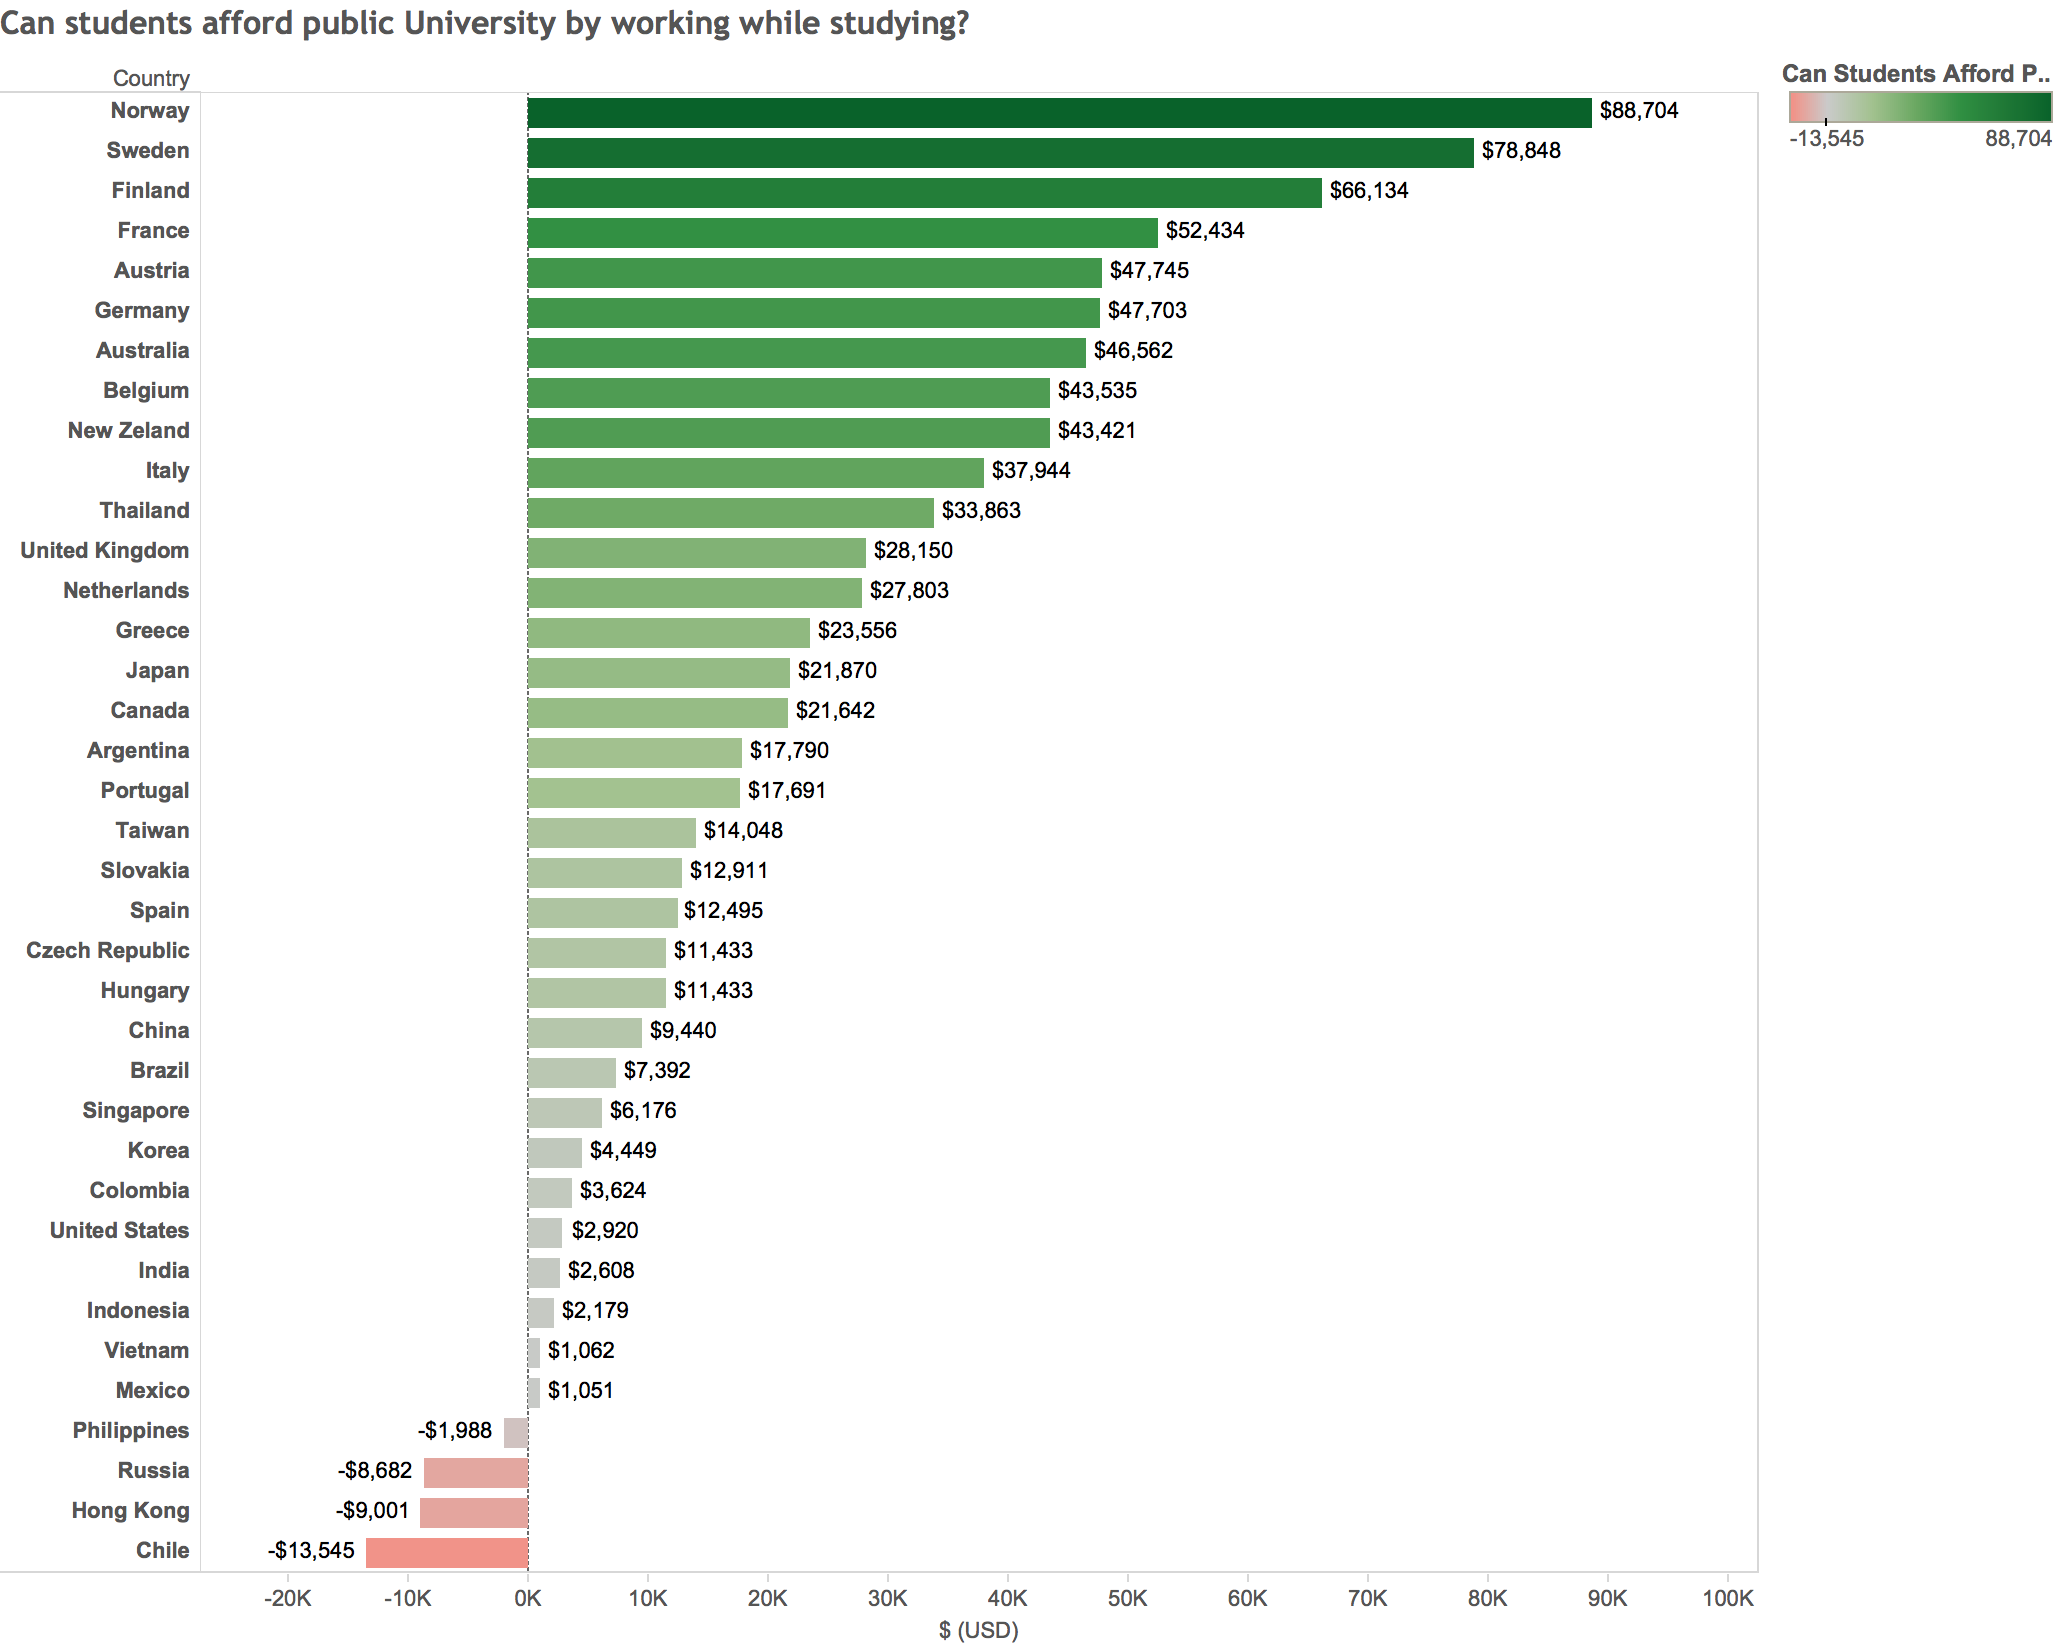
What is the state of University tuition costs around the world?
We found out that students can't afford their living expenses and tuition costs by working at minimum wage while studying.
However, students in 83% of the countries we looked at can afford to pay off their public University tuition by working during their studies. Students will need to find alternative funding to be able to afford both living expenses and tuition at the same time. This could explain why the number of young adults living with their parents is increasing – to save on living expenses.
Students are more likely to take out loans if they can't rely on their parents for support. This would explain why the average debt per graduate in the United States is $35,051 (2015).
In this tutorial you will learn how to:
Part 1: Using a web scraping tool
- Scrape data from a website that displays wage statistics in a table with a web scraping tool.
- Clean up text on webpage with regular expressions.
- Set up ParseHub to automatically scrape the local currency and run the numbers through a currency converter to get all of the wages in USD.
Part 2: Using Tableau to visualized scraped data
- Clean up the data in Excel, in preparation for Tableau.
- Create a bar graph in Tableau to display your data.
- Make a map visualization from the data you scraped with ParseHub.
1. Use ParseHub to scrape statistics from tables
First, we will to set-up ParseHub – a web scraping tool – to automatically collect statistics from two tables:
Now, you don't need to copy and paste data from the two tables manually. Instead of hiring someone to copy and paste data for you – you can save money by setting up a web scraping application to collect the data for you. As a result all of the statistics will be scraped into an Excel file for you.
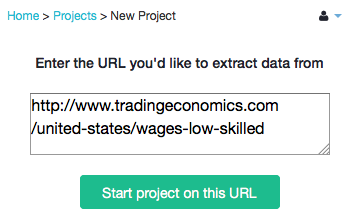
Step 1: Open up ParseHub & the Economics Website
- Go to ParseHub.com to download the web scraping desktop up and sign up.
- Open the desktop application and click "New Project".
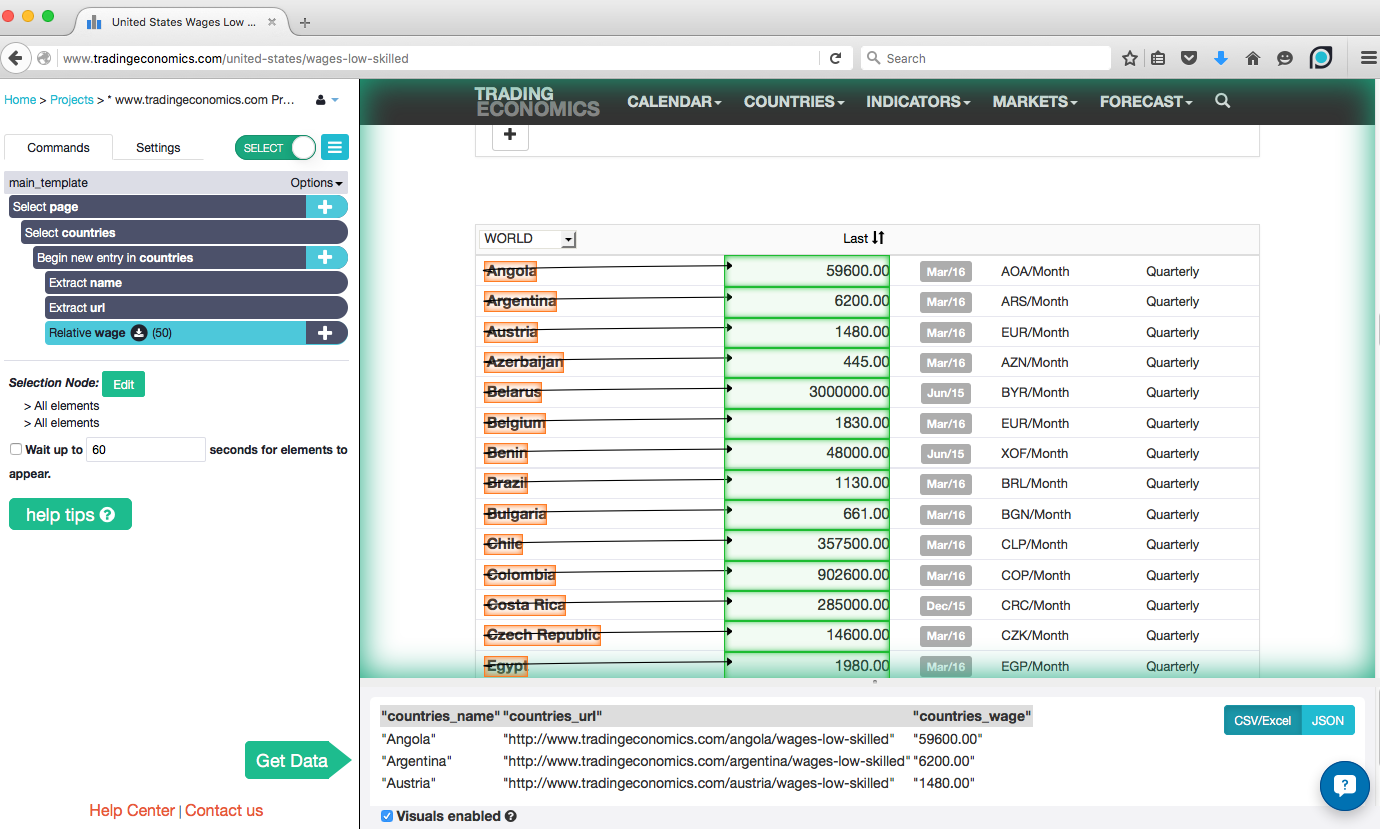
- In the text box on the next page enter the following url – http://www.tradingeconomics.com/united-states/wages-low-skilled – this website contains the statistics tables for wages in 40 different countries.
- Click "Start project on this URL". You will be taken to the main_template of ParseHub where you will put in instructions to scrape this website. The website will also automatically open for you.
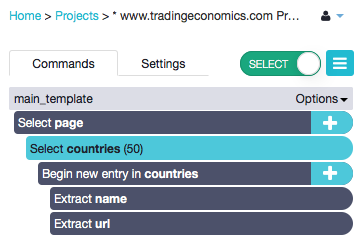
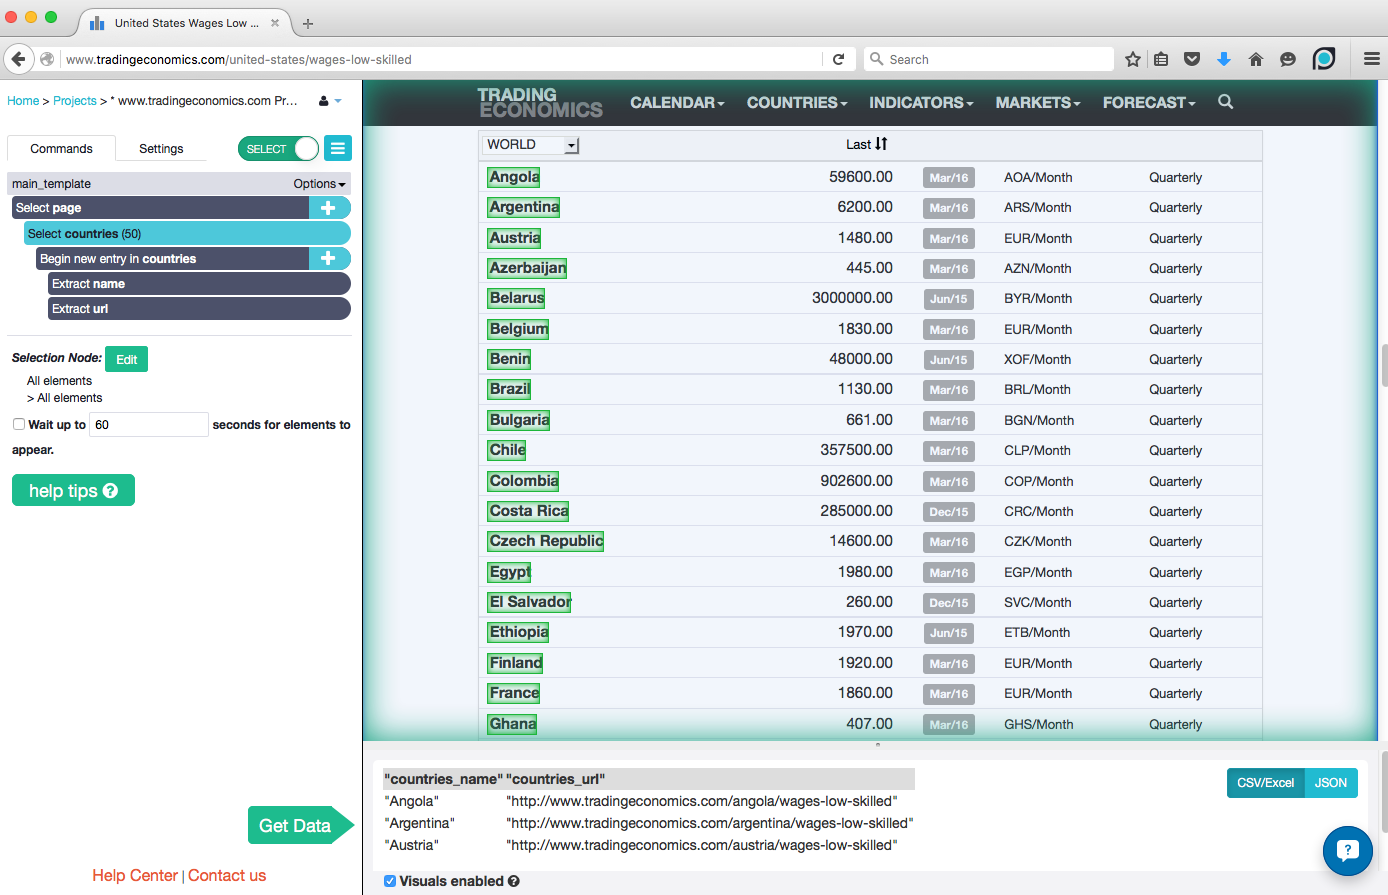
Step 2: Set-up web scraper to extract all of the data into an Excel file
Scrape all of the country names and their urls:
- Scroll down to to the table that has the low skilled wages for all of the countries.
- Click on the first country that you see "Angola"
- Now, click on the second country. All of the countries should be selected for you in green. Rename the selection1 command to "countries".
That is it! All of the countries and the url for the countries profile is now extracted for you If you click on the "CSV/Excel" blue button in the bottom right corner of the browser you will be able to see how the results will look like in Excel.
View of the ParseHub side-bar:
View of the entire web scraping desktop app:
Scrape the wages for all of the countries and the currency type.
Collect the wages for each country:
- Click on the plus button next to the "Begin new entires in countries" command to make another selection in the table.
- From the menu that pops out choose the "Relative Select" tool. This tool will let you create a relationship between one data point on the table and another. It will also make sure that data points that are similar show up in the same row in Excel.
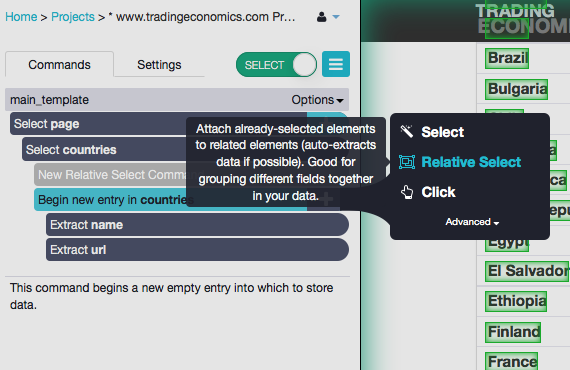
- Click on one country – for example Angola.
- Now click on the wage for that country in the next column. An arrow should appear between all of the countries and all of the wages. Rename the "Relative selection" command to wages.
All Done! ParseHub will now scrape all of the wages for each country into your Excel file
View of the ParseHub side-bar:
View of the entire web scraping desktop app:
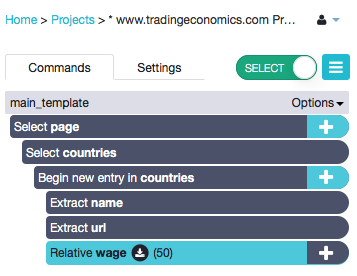
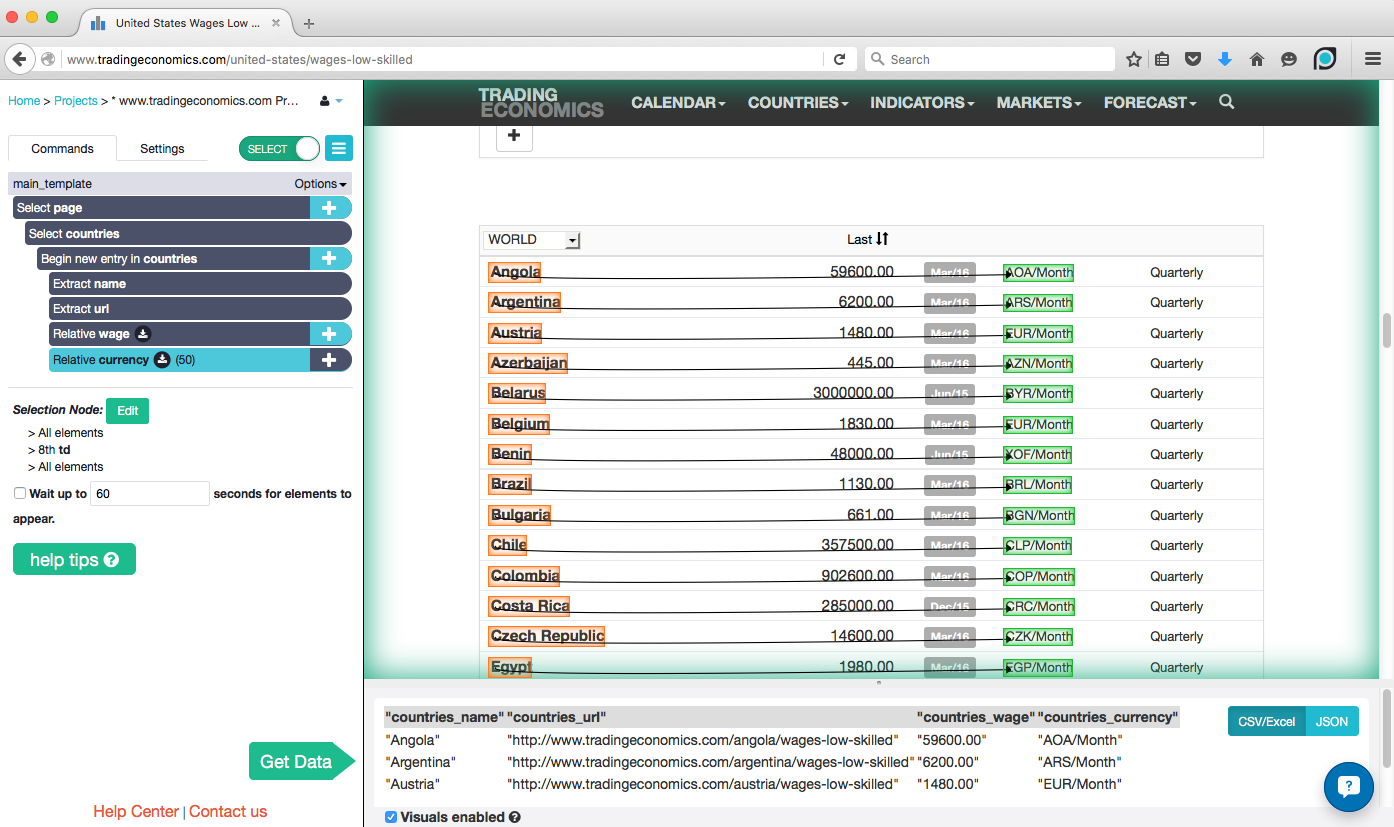
Collect the currency for each country:
Let's repeat the steps above to scrape the currencies for 50 countries that we are getting wages for. We will need this information to enter it into a currency converter later.
- Click on the plus button of the "Begin new entry in countries" command.
- From the menu that pop-ups choose the "Relative Select" tool again so you can select another data point that relates to the countries in the table.
- Click on the first country.
- Click on the currency in the 4th table – for example "AOA/Month". All of the currencies for all of the countries should be highlighted for you in green. Rename the "Relative select" command to "currency"
View of the ParseHub side-bar:
View of the entire web scraping desktop app:
2. Clean up text with Regular Expressions
ParseHub has regular expressions built into it. You can use this more advanced feature to clean up your data before it even appears in your Excel file. This takes away one cleaning step you will have to do with your data after downloading the Excel file.
In this example the currency in the table is displayed as EUR/Month. We want to take away the /Month portion and have it displayed as EUR.
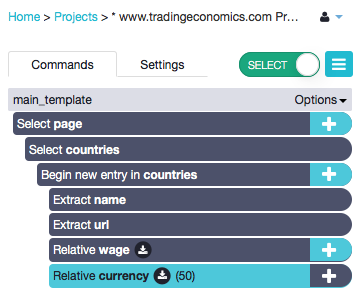
- Click on the plus button on the "Relative currency" command.
- On menu that pops up click on "Advanced" to display more tools.
- Choose the "Extract" tool. This tool will let you display the actual extraction for the "Relative currency" command and you will be able to modify it.
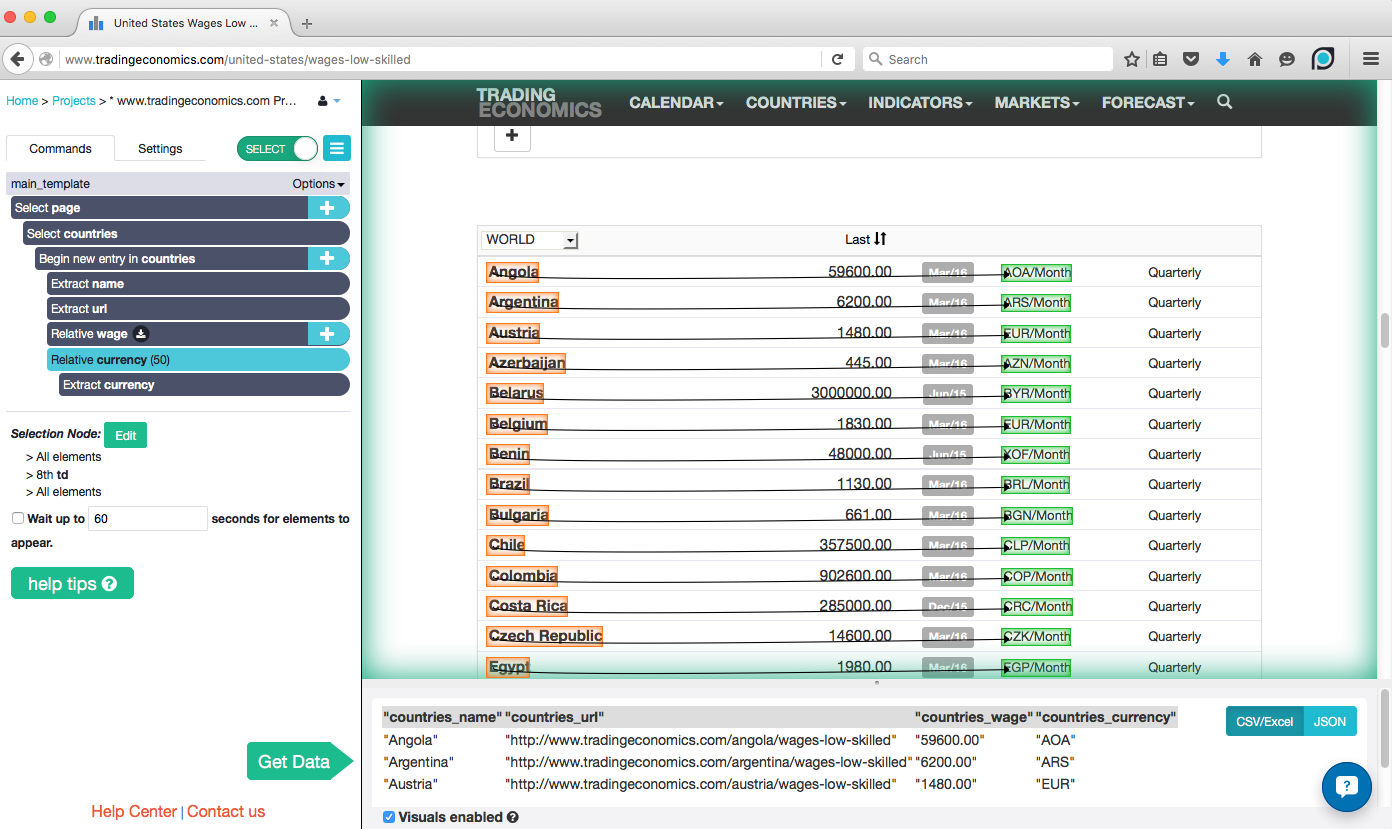
- In the bottom panel that appears under the "Extract currency" command click on the "Use regex" option.
- In the "regex" text box type (.*)/Month. This will let you scrape cleaned up numbers without the /Month.
View of the ParseHub side-bar:
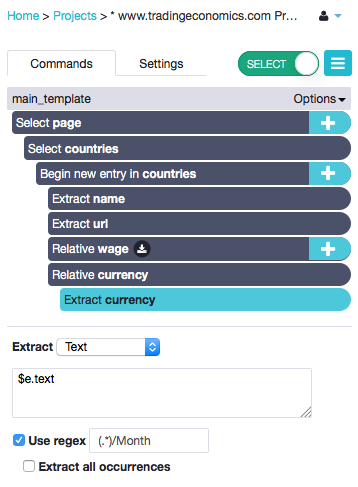
View of your sample results:
Notice how the "countries_currency" table was cleaned up to match the regular expression on the currency command.
3. Automatically convert local currencies to USD in 10 minutes
Now, we will set-up ParseHub to input the data scraped from the statistics tables into a currency converter. As a result you will be able to download an Excel file with all of the wages from 40 countries converted into USD.
You don't have to waste hours manually converting the wages from their local currency to USD for a research project. You can use a web scraper to automate the task of conversion for you. In this example, we will use ParseHub to automatically fill out search forms and to click on drop-downs in order to convert currency.
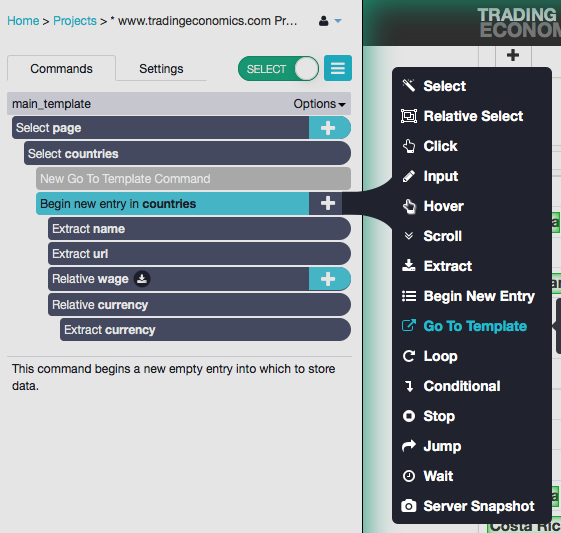
Step 1: Set up web scraper to navigate from one website to another website
- Click on the plus button of the "Begin new entry in countries command.
- Click on the "Advanced" text in the pop-up menu that appears to display more tools.
- Choose the "Go To Template" tool from the menu. This tool will let you enter the url of a new website that you want to navigate too.
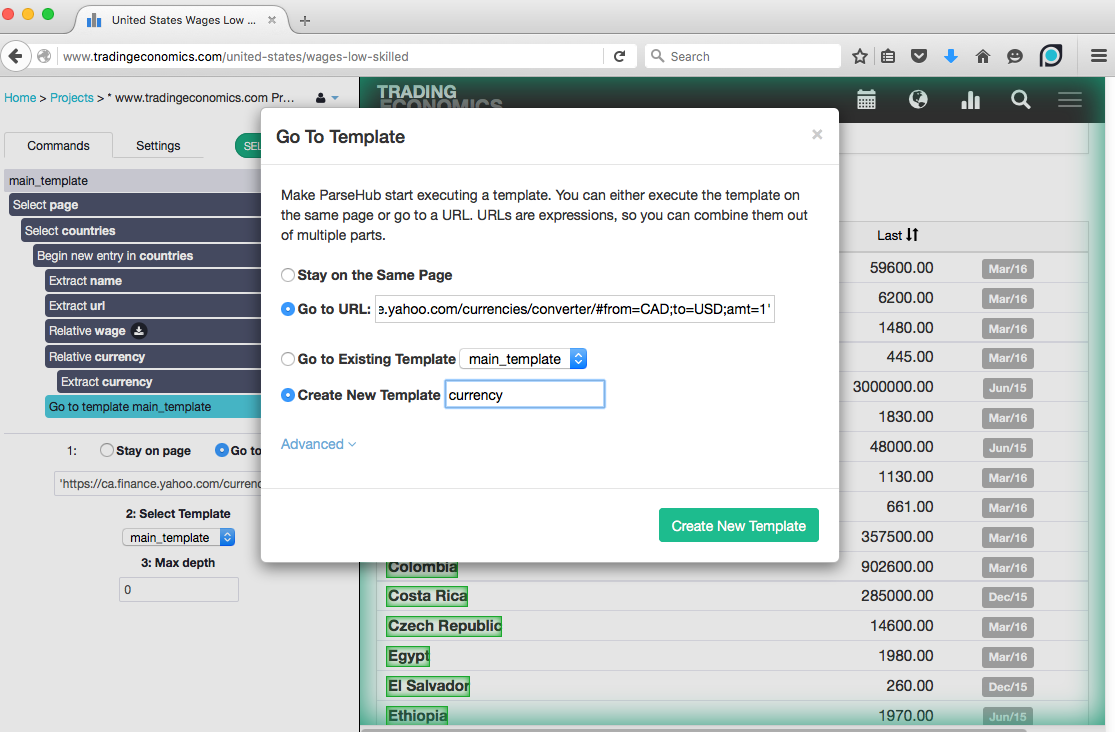
 4. In the pop-up box that appears enter the following url in single quotes into the "Go to URL" text box – *'https://ca.finance.yahoo.com/currencies/converter/#from=CAD;to=USD;amt=1'*
5. In the pop-up box also type in the name of the new template in the text box – "currency".
6. Click "Create New Template". This will tell ParseHub to create a new template to store all of the instructions for the new website that you want to navigate to.
4. In the pop-up box that appears enter the following url in single quotes into the "Go to URL" text box – *'https://ca.finance.yahoo.com/currencies/converter/#from=CAD;to=USD;amt=1'*
5. In the pop-up box also type in the name of the new template in the text box – "currency".
6. Click "Create New Template". This will tell ParseHub to create a new template to store all of the instructions for the new website that you want to navigate to.
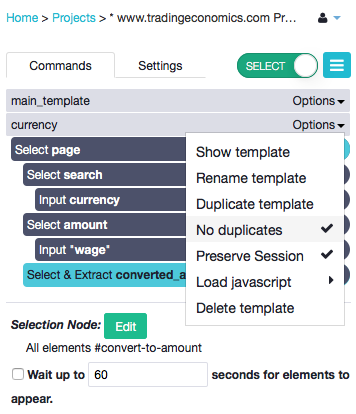
Step 2: Set up web scraper to automatically fill out search forms and grab results
- Make sure that your second template allows for duplicates first.
- Click on the "Options" dropdown from the "currency" template. Click on the "No Duplicates" option and make sure it is de-selected. This will make sure that ParseHub will visit the currency conversion website multiple times.
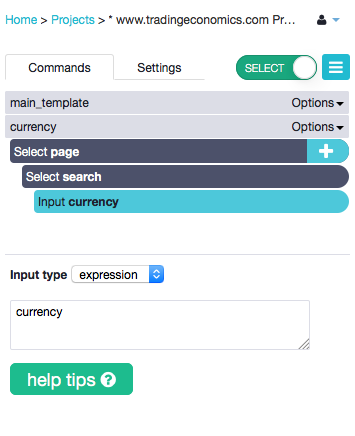
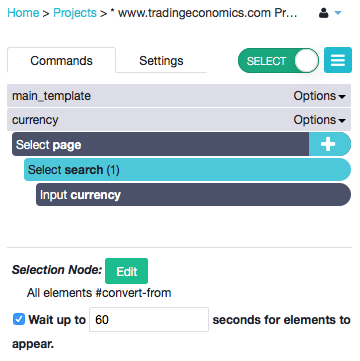
- Click on the text box that currently displays "Canadian Dollar CAD" to input the type of currency that you want to convert to USD. This will select it and add an Input command.
- In the Input text box type in currency.
- From the "Input type" dropdown box select "expression".
- Rename the "selection1" to "search".
 7. Make sure the search command is selected. Click on the "Wait up to 60 seconds for element to appear" checkbox. ParseHub will wait to make sure that the input box appears before proceeding to the rest of the instructions.
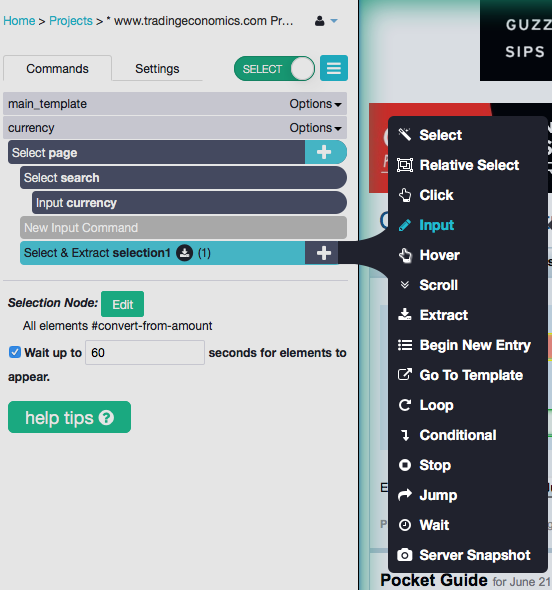
- Click on the plus button of the "Select page" command.
- From the menu choose the Select tool.
- Click on the amount search box. It should be selected in green for you. Rename the Select & Extract selection1 command to "amount".
- Click on the "Wait for up to 60 seconds for elements to appear" text box.
- ParseHub did not automatically detect that an input box was selected so you have to tell ParseHub to input text by choosing the input tool.
- Click on the "Select & Extract selection1" command plus button.
- On the menu click on the "Advanced" text box to open up the menu.
- Choose the input tool from the extended menu.
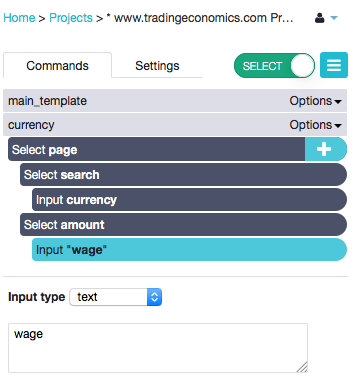
 9. Type in "wage" into the input box.
10. From the drop-down select "expression".
9. Type in "wage" into the input box.
10. From the drop-down select "expression".
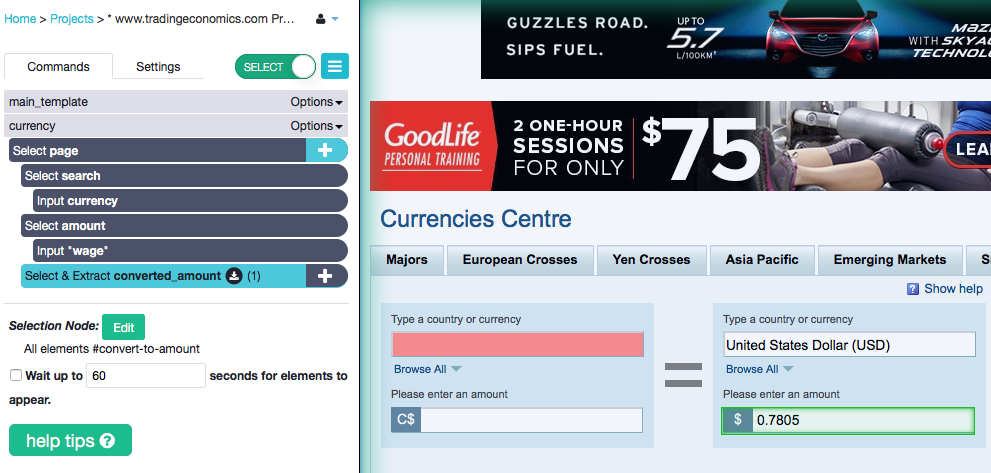
 11. Click on the **plus button** of the Select page command and choose the select tool from the menu.
12. Click on the text box on the right that shows the converted amount. Rename the "Select & Extract" node to converted amount.
13. Click on the "Wait up to 60 seconds for elements to appear" check-box.
11. Click on the **plus button** of the Select page command and choose the select tool from the menu.
12. Click on the text box on the right that shows the converted amount. Rename the "Select & Extract" node to converted amount.
13. Click on the "Wait up to 60 seconds for elements to appear" check-box.
Step 3: Run ParseHub to scrape statistics & download data
- Click on the green "Get Data" button.
- Click "Run"
- Click "Save and Run" one more time
Your results will appear on this page and will be available for download via Excel or JSON when ParseHub is done scraping all of the pages. Alternatively, you will get an email with the link to download your results.
Sources:
- Currency converter - Yahoo - all costs were converted into USD.
- Trading Economics and Wage Indicator were used to find the low skilled wages,
minimum wages and individual living wages. - ParseHub a web scraping tool was used to collect data easily and quickly.
- Tableau was used to analyze and visualize information.
- A variety of sources were used to calculate the private and public tuition rates for Universities - 1, 2,
3.
Continue Reading...
Use Tableau to Visualize Scraped Data
coming soon!